Use infographics for visual impact.
How can your publications present data about attendance, offerings, fundraising, budgets and more without overwhelming readers or quickly making their eyes glaze over? The solution is infographics!
An infographic (or information graphic) is a visual representation of data or other information. They’re more than the plain old charts and graphs you remember from school. Infographics use eye-catching, appealing visuals to grab attention and communicate information quickly and clearly. But they aren’t just an attractive picture. The images used in an infographic must help us understand and remember the content of the infographic.
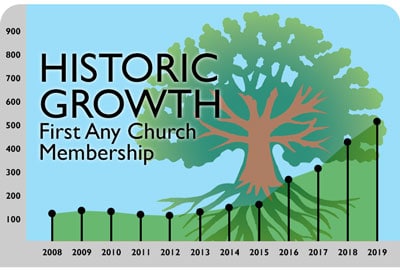
Line graphs
This type of infographic is ideal for showing changes over time, such as this example showing VBS attendance over the years:
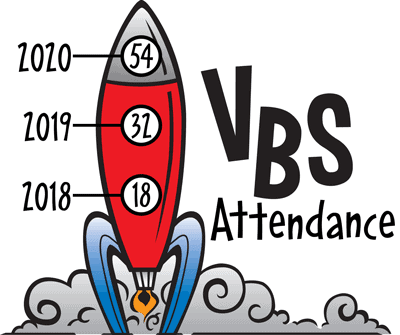
Draw lines from point to point to indicate progress made. You can add visual interest by placing the graph inside an illustration:
To avoid confusion, limit graphs to as few lines as possible. Use different colors or screen tints to separate lines from each other.
Bar Chart Infographics
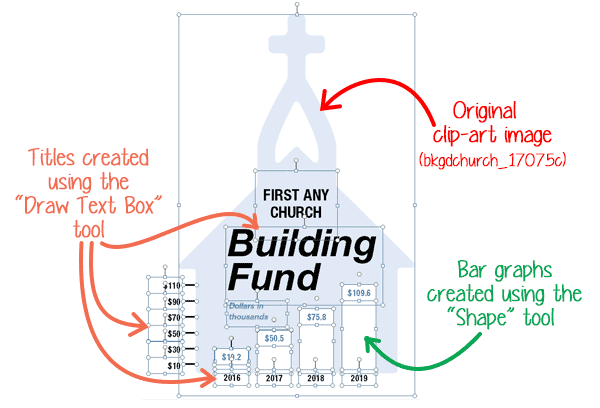
Bar charts make comparisons. Use them to compare percentages or averages, such as the amount of money your church spent on your Building Fund or VBS in each of the last five years.

Bar charts may have simple horizontal or vertical bars, be three-dimensional or be shaped like a thermometer or something similar for extra pizzazz!
Many of you have reached out asking “how” to create an infographic. Our artists used InDesign and Photoshop to create the examples we’ve shown above, but fear not! You can actually build some of these in Publisher.
Creating an infographic in Publisher
First, insert an image of your choice into the document. Then, using Publisher’s shapes and text element tools, add items in front of the clipart to create charts, titles and data.
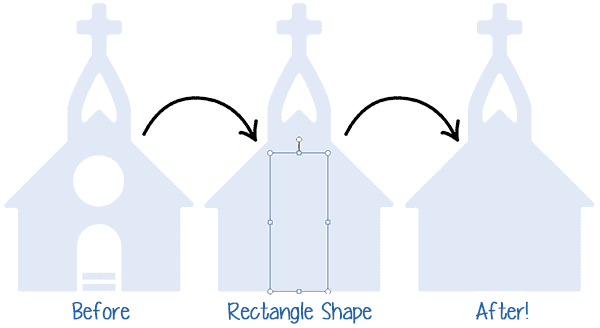
Fun Tip: Does an image have holes you want to fill? Use a shape box to overlay the image, and use the “eyedrop” tool to match the color. Then use Publisher’s Group feature to keep the box with the image!
Although it’s possible to create these images in Word, it takes a lot more patience to get things just right. We recommend sticking with Publisher for this sort of overlaying design.
ChurchArt Team
We love art, are passionate about helping churches create professional-looking communications and are a fun bunch of folks. With an in-tune creative director and a rock-solid team of artists, we will provide the art you’ll want to use, plus templates, puzzles and extras that make your job easier.
Share This Post:
All the church-specific art you need IN ONE PLACE.