Month: January 2021
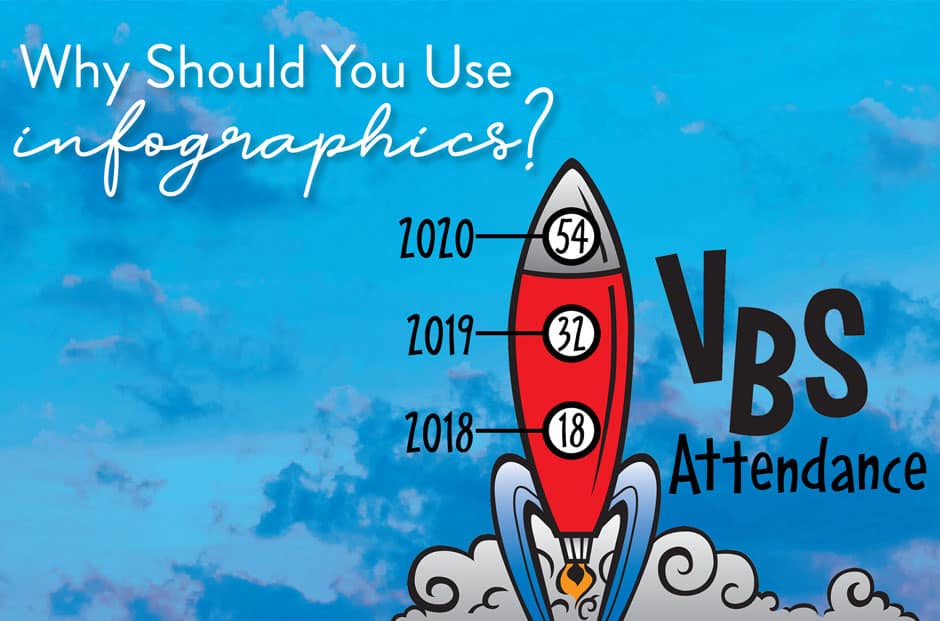
Use infographics for visual impact.
How can your publications present data about attendance, offerings, fundraising, budgets and more without overwhelming readers or quickly making their eyes glaze over? The solution is infographics! An infographic (or information graphic) is a visual representation of data or other information. They’re more than the plain old charts and graphs you remember from school. Infographics…


